
Power BI · DAX · Power Query · Dashboard delivery
Power BI Training in Bangalore — DAX, Power Query & Microsoft Copilot AI
Build the whole reporting chain: prepare data in Power Query, model relationships, write measures in DAX, design a dashboard and publish it with the right access and refresh decisions.
- Duration
- 20 live hours
- Core skills
- Power Query, modelling and DAX
- Output
- A checked interactive report
- Delivery
- Live online or corporate onsite
What is the Power BI Training course?
Power BI Training is a 20-hour instructor-led programme for analysts and reporting teams. Participants move from raw files to a reusable semantic model, write and test DAX measures, build an interactive report and plan how it will be refreshed and shared. Copilot is included where the client environment meets Microsoft’s capacity, tenant and region requirements; the core course does not depend on Copilot access.
Is this the right course for you or your team?
Who it is for
- Data and business analysts
- Finance, MIS and operations reporting teams
- Excel users moving to governed dashboards
- BI developers who need stronger DAX and modelling foundations
Situations it fits
- Reports depend on manual Excel consolidation
- A model has many tables but unclear relationships
- DAX measures return plausible but incorrect totals
- Publishing and refresh ownership are not defined
Prerequisites
- Comfort working with tables and business data
- Basic Excel is useful; SQL is helpful but not required
- Power BI Desktop installed before the first lab
- Copilot access is optional and checked separately
Power BI, Excel or Tableau—which course fits?
Choose according to the work participants must perform after training.
| Course | Best for | Choose it when |
|---|---|---|
| Power BI Training This course | Microsoft-centred BI reporting | Choose this for Power Query, semantic modelling, DAX and Power BI publishing. |
| Advanced Excel Training | Spreadsheet reporting and models | Choose this when formulas, PivotTables and workbook workflows are the immediate gap. |
| Tableau Training | Tableau calculations and visual exploration | Choose this when Tableau Desktop, Server or Cloud is the organisation’s reporting platform. |
The business problems this course addresses
The programme follows the failure points that make Power BI reports hard to trust or maintain.
| Task | The usual problem | What participants practise |
|---|---|---|
| Monthly data preparation | Analysts repeat cleanup steps across files. | Build parameterised, refreshable Power Query transformations. |
| Data modelling | Flat tables and ambiguous relationships create incorrect totals. | Design a star schema with clear grain, keys and relationship direction. |
| Business calculations | Measures work on one visual and fail under another filter. | Reason about filter context and test DAX against known totals. |
| Dashboard design | Pages are crowded and the audience cannot see the decision. | Use an information hierarchy, purposeful interactions and a review checklist. |
What participants will be able to do
Practise the skills below through course exercises, then check the results and explain how you would apply them to your work.
Prepare reusable data
Connect, clean, reshape and combine sources using documented Power Query steps.
Design a sound model
Define fact and dimension tables, relationships, grain and a maintainable date table.
Write and test DAX
Build measures for KPIs, time comparisons, ranking and contribution, then reconcile their results.
Create an interactive report
Use visuals, filters, drill paths and tooltips to support a defined audience decision.
Plan publishing and refresh
Identify workspace, access, refresh and ownership decisions before handover.
Use Copilot conditionally
Draft measures, visuals or summaries where access allows, while reviewing the generated logic and figures.
Role-based use cases
How each team applies it to real work
The same Power BI stack is applied differently depending on the reporting function.
Finance & FP&A
- Reporting task
- Actual-versus-budget and period variance reporting.
- What participants build
- A model with controlled measures, time comparisons and a management variance page.
- Quality check
- Ledger reconciliation, sign conventions, period filters and approved KPI definitions.
Sales & commercial
- Reporting task
- Pipeline, conversion, territory and product performance.
- What participants build
- Interactive views that move from company totals to account and product detail.
- Quality check
- Duplicate opportunities, stage definitions and attribution assumptions.
Operations
- Reporting task
- Throughput, service levels, inventory and exceptions.
- What participants build
- A daily or weekly operational view with drill-through to problem records.
- Quality check
- Refresh timing, late-arriving data and threshold logic.
HR & people analytics
- Reporting task
- Headcount, hiring, movement and attrition trends.
- What participants build
- A restricted report with aggregated views and approved audience access.
- Quality check
- Privacy, small-group exposure and consistent denominator definitions.
The tools behind a maintainable Power BI report
The course covers the desktop authoring workflow and the service decisions needed to share it responsibly.
Power BI Desktop
by MicrosoftReport authoring, modelling and measure development.
- Connecting and shaping data
- Building the semantic model
- Creating and testing report pages
- Used in
- All core labs and the final report.
- What to verify
- A visually correct report still needs reconciled totals and a documented model grain.
DAX
by MicrosoftCalculation language for measures, calculated columns and tables.
- Business KPIs
- Time intelligence
- Ranking and contribution analysis
- Used in
- Measure-writing and debugging labs.
- What to verify
- Test measures under different filters; context can change the result.
Power BI Service
by MicrosoftPublishing, sharing, refresh and workspace governance.
- Workspace planning
- Access and sharing
- Refresh and handover
- Used in
- Publishing walkthrough or environment-specific demonstration.
- What to verify
- Licensing, capacity, permissions and gateways depend on the client environment.
Copilot in Power BI
by MicrosoftOptional — environment eligibility checked before delivery
Optional AI assistance for analysis, DAX and report creation.
- Drafting measures
- Exploring a semantic model
- Generating summaries where available
- Used in
- Demonstration plus hands-on lab when the environment qualifies.
- What to verify
- Microsoft requires eligible capacity, tenant settings and a supported region; Pro or PPU alone is not sufficient.
Power Query prepares the data, the model defines how tables relate, DAX calculates business meaning, and the report presents it.
20 hours · 20 live hours
Detailed curriculum
4 modules, each pairing short instruction with guided practice. Sequence and examples can be adjusted after the training-needs discussion; the core outcomes stay the same.
Session 15 hours · indicative allocation Power BI foundations and data modelling
- Desktop report, table and model views; Excel, CSV and database connections
- Table grain, keys, fact and dimension tables in a star schema
- Relationship cardinality, cross-filter direction, date tables and model checks
- Build a first report with charts, slicers and cards
Practical activityBuild a model from sales transactions and reference tables.
Session 25 hours · indicative allocation Power Query for repeatable preparation
- Types, errors, nulls, duplicates and profiling
- Merge, append, group, pivot and unpivot operations
- Applied steps, M-language basics and conditional columns
- Parameters and folder-based combinations
Practical activityTurn monthly files into one refreshable preparation flow.
Session 35 hours DAX measures that survive filters
- Measures, calculated columns, row context and filter context
- SUM, COUNT, DISTINCTCOUNT, DIVIDE and IF for business measures
- CALCULATE and filter modification
- TOTALYTD, SAMEPERIODLASTYEAR and DATEADD with a suitable date model
- RANKX, TOPN and variables for ranking and readable measures
Practical activityBuild and reconcile a KPI measure pack.
Session 45 hours Dashboard design, publishing and Copilot
- Visual hierarchy and interaction design
- Bookmarks, drill-through, tooltips and accessibility
- Workspaces, sharing permissions and row-level security basics
- Scheduled refresh and gateway setup where the data source requires it
- Optional Copilot exercises subject to the available licence and workspace configuration
Practical activityComplete a report, review it against a checklist and present the decisions it supports.
Need a learning plan around your goals?
Share your experience, stack and goals. The proposal sets out the suitable modules.
Power BI Use Cases by Industry
Use these industry examples to choose a relevant dashboard brief for your team. The selected exercises depend on the agreed agenda, available data and starting skills; this is not a promise to complete every dashboard in one course.
🏦BFSI & Banking
- Branch performance dashboards with regional drill-down
- Loan portfolio analysis with risk segmentation
- Collections dashboard with day-wise ageing buckets
- Regulatory reporting automation from core banking data
E-commerce & Retail
- Sales performance across SKUs, categories and geographies
- Inventory and stockout alert dashboards
- Customer cohort and RFM analysis
- Marketing spend ROI with channel attribution
IT Services & SaaS
- Project delivery and utilisation dashboards
- Revenue and ARR tracking with churn analysis
- Sales pipeline and forecast dashboards
- Employee productivity and HR analytics
Manufacturing & FMCG
- OEE (Overall Equipment Effectiveness) dashboards
- Supply chain and procurement analytics
- Quality defect tracking by plant and shift
- Distributor performance and secondary sales
Healthcare & Pharma
- Hospital operations: OPD, IPD and bed occupancy
- Clinical trial data monitoring dashboards
- Prescription analytics by territory and molecule
- Medical device sales performance tracking
Consulting & Professional Services
- Client engagement profitability dashboards
- Resource allocation and bench strength reporting
- KPI scorecards for client deliverable tracking
- Practice performance across service lines
Power BI, Excel or Tableau: choose around the work
Start with the task and your organisation’s reporting environment, not a universal tool ranking. Excel is useful for spreadsheet-based exploration and financial models; Power BI suits a reusable model and shared reporting workflow; Tableau is another route for interactive visual analysis. Learning more than one tool can help, but is not a prerequisite for every analyst role.
- For recurring management dashboards, assess data preparation, the semantic model, refresh, access control and distribution—not only chart design.
- For ad-hoc calculations and scenario models, strengthen spreadsheet fundamentals before adding a reporting platform.
- If your employer already uses Tableau, build on that environment rather than switching solely for a course.
- Compare the actual licences, capacity, sharing requirements and administrator setup. Do not assume Microsoft 365 includes every Power BI or Copilot capability.
Compare Tableau training, Advanced Excel training and SQL for querying the source data.
Where Power BI skills fit in your career
The original role pathways include Data Analyst, Business Intelligence Analyst, MIS Executive or Manager, BI Developer, Reporting Analyst, Analytics Consultant and Power BI Specialist. A course supports skill development; suitability for a vacancy also depends on experience, domain knowledge and the rest of the role’s requirements.
Build a portfolio that shows the source data, preparation steps, model relationships, tested measures and a dashboard that answers a business question. For a developer-oriented role, explain refresh, permissions and maintenance as well as the visuals. Use synthetic or approved data in anything you publish.
Exercises and practical outputs
Participants build one reporting solution progressively instead of completing disconnected feature demonstrations.
How every module runs
Prepare
Inspect and transform the source data.
Model
Define the grain, relationships and business entities.
Calculate
Write measures and reconcile them to known totals.
Present and govern
Design the report and document publishing, access and refresh.
Exercises use representative, non-sensitive examples. Outputs are produced during the workshop for practice and review; anything participants keep is their own working material.
A correct-looking report can still be wrong
Every course treats data quality, calculation review and access control as part of the analytical workflow—not as an optional final check.
Check the current product documentation and your organisation’s data-handling rules before applying these workflows.
Use approved data
Use public, synthetic, sanitised or organisation-approved datasets. Remove personal and confidential fields before using external AI services.
Trace every number
Reconcile row counts, totals, filters, joins and time periods against the source before a report supports a decision.
Review generated logic
Read formulas, DAX, SQL, calculated fields and Python generated with AI. Test boundary cases instead of trusting fluent output.
Publish with controls
Confirm permissions, refresh ownership, data classification and reviewer responsibility before sharing a workbook or dashboard.
How the course is tailored and delivered
Private programmes are adapted around the reports, datasets, tool versions and decisions participants handle at work. Public cohorts use neutral practice data so people from different organisations can work safely.
From first conversation to evaluation
Map the work
Identify participant roles, current skill level, recurring reports and the decisions the training should support.
Confirm the environment
Check software versions, licences, database access, security rules and whether client data may be used in exercises.
Shape the labs
Choose representative datasets and outputs, then set the depth of formulas, modelling, visualisation or code.
Practise and review
Participants build during the session, explain their choices and use a review checklist before presenting the result.
Delivery formats
Public live-online cohort
Best for: Individuals and small teams following a published cohort schedule
Instructor-led sessions run on Zoom with notes, assignments, lab instructions and recordings in the Technovids LMS. Recording access lasts three months after the cohort.
Private corporate programme
Best for: Teams that want their own datasets, reporting standards and delivery calendar
Delivered live online or onsite. Scope, participant count, exercises, materials, support and commercials are confirmed in the written proposal.
Delivery modes
Live online
Interactive instructor-led sessions with screen sharing, guided practice and review. Public cohorts are hosted through Zoom and the Technovids LMS.
Onsite for corporate teams
Delivered at the client location with the same practical curriculum, using approved or sanitised organisational data where appropriate.
Practical training, with people doing the work
A selection of Technovids instructor-led sessions. The photographs show delivery environments, not results attributed to a particular course or client.

Photo 1 of 10: Hands-on session 
Photo 2 of 10: Group photo 
Photo 3 of 10: Hands-on session 
Photo 4 of 10: Group photo 
Photo 5 of 10: Classroom session 
Photo 6 of 10: Group photo 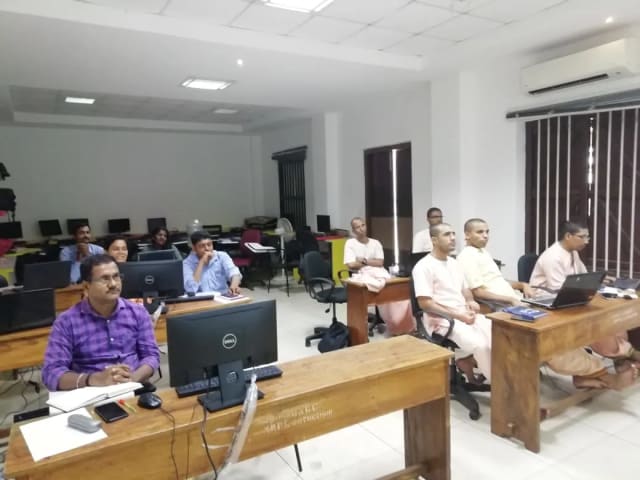
Photo 7 of 10: Computer-lab session 
Photo 8 of 10: Group photo 
Photo 9 of 10: Classroom session 
Photo 10 of 10: Group photo
Course details at a glance
The published course parameters on one page. Final scope, dates and fees are confirmed in the written proposal.
Discuss your training goals| Course | Power BI Training |
|---|---|
| Duration | 20 live hours; final module depth confirmed before delivery |
| Audience | Analysts, MIS, finance, operations and BI teams |
| Prerequisite | Comfort with tabular data; basic Excel useful; SQL not required |
| Core environment | Power BI Desktop; service and Copilot depend on organisational access |
| Delivery | Public live online; private live online or onsite |
| Assessment | Model, DAX lab, final report and participant explanation |
The trainer assigned to your programme
Technovids assigns a trainer whose technical depth and delivery experience fit the agreed curriculum and audience.
Pankaj Rana
Co-founder & Lead Instructor, Technovids Consulting
Pankaj is a co-founder and the lead instructor at Technovids Consulting. His programme work spans practical AI adoption, AI engineering, evaluation, responsible production AI, data analytics and corporate learning design, with an emphasis on hands-on exercises connected to workplace tasks.
Expertise:
- Practical AI adoption
- Prompting and evaluation
- Responsible AI
- Corporate learning design
Junaid Khateeb
AI & Machine Learning Trainer, Strategist and Consultant
Junaid is an AI and machine-learning trainer, strategist and consultant with more than 22 years of training experience. His work combines enterprise AI education, business-centred adoption, responsible AI practices and applied solution design, helping professional audiences connect AI concepts to real organisational needs.
M.E. in Computer Engineering, specialising in Artificial Intelligence · author of programming books on Python, Java and C++
Expertise:
- Enterprise AI and ML training
- AI strategy and adoption
- Responsible AI
- Applied AI solution design
Pradeep Varadarajan
Technical Trainer & Curriculum Architect
Pradeep is a technical trainer and curriculum architect with more than 20 years of experience across enterprise technology, cloud infrastructure and advanced AI systems. He designs practitioner-focused programmes, labs and assessments covering AI, LLM systems, Python and machine learning, translating complex technical subjects into structured learning experiences.
Bachelor of Engineering in Electrical Engineering · instructor-led, virtual and blended delivery
Expertise:
- AI and LLM systems
- Curriculum architecture
- Python and machine learning
- Hands-on lab design
The final trainer assignment is confirmed with the cohort schedule or corporate proposal.
Updated
Organisations we have trained, and participant perspectives
Client relationships and permissioned participant feedback provide context on Technovids delivery. They are not promises of a specific learning or business outcome.
Organisations we have delivered training for




















Practical training programmes delivered for learners, professionals and teams across AI, data, cloud, productivity and professional skills.
Participant experiences across workplace roles
What professionals found useful, practical and relevant to their day-to-day work.
- Gauraw DeshmukhData Engineer · Capgemini
Technovids AI training was very practical and well structured. The sessions helped me understand how AI concepts can be applied in real data engineering and business workflows, instead of only learning theory. The trainer explained the topics clearly with relevant examples, which made the learning experience valuable and easy to follow.
- PriyanshaSoftware Developer
The AI training from Technovids helped me gain a better understanding of Generative AI, prompt engineering, and practical AI use cases for software development. The course was clear, interactive, and focused on real-world applications. It gave me confidence to explore AI tools more effectively in my work.
- Sidda RajuData Engineer
Technovids delivered the AI training in a very practical and industry-relevant way. As a data engineer, I found the examples and hands-on discussions useful for understanding how AI can improve data workflows, automation, and decision-making. The sessions were well planned and easy to understand.
- Akshat KabraData Engineer
The AI training program by Technovids was insightful and professionally delivered. It covered important AI concepts in a simple and practical manner, with examples that connected well with data and analytics use cases. The sessions helped me build a stronger foundation in applying AI in real business scenarios.
- MangeshSoftware Engineer · Siemens
Technovids conducted the AI training in a very effective and engaging manner. The sessions were practical, easy to follow, and focused on how AI can be used in real software engineering and business workflows. It was a valuable program for understanding the current direction of AI adoption in the industry.
- ReshuSoftware Developer
Technovids AI training was a very useful learning experience. The course explained AI concepts in a practical way and showed how developers can use AI tools to improve productivity, problem-solving, and application development. The trainer's approach was simple, clear, and focused on industry use cases.
Common questions before planning this course
Answers about the published course. The written proposal records any agreed customisation, delivery details and commercials.
Are public cohorts available for Power BI Training?
Public cohorts are offered live online when dates are published. Submit an enquiry for the next available schedule. A date is not reserved until Technovids confirms the cohort in writing.
What is included for a public-cohort learner?
The Technovids LMS includes session notes, assignments, lab instructions and recordings for three months after the cohort. Completion requirements and the certificate process are explained at the start.
Is a completion certificate provided?
Yes. Learners who meet the stated completion requirements receive a Technovids completion certificate with a unique certificate ID that can be verified on the Technovids website. It is not a vendor certification.
Who provides the laptop, software and licences?
Participants use their own suitable laptop. The required software version, accounts and licences are confirmed before delivery. For private programmes, a sandbox or virtual machine can be scoped separately when needed.
Can the course be delivered for a corporate team?
Yes. The private version can use your approved datasets, reporting standards and business scenarios. Delivery may be live online or onsite, with scope and commercials confirmed in the proposal.
Do I need Excel or SQL before learning Power BI?
Basic comfort with tables and business data is enough for the foundation route. Excel helps with familiar reporting concepts, and SQL helps with database work, but neither is a mandatory prerequisite for the standard programme.
Is Copilot included?
Copilot concepts and review practices are included. Hands-on Copilot use depends on eligible Microsoft capacity, tenant settings, permissions and region. When it is unavailable, the core modelling, DAX and dashboard labs continue without it.
Is this a Microsoft certification course?
No. This is practical Power BI training delivered by Technovids. The completion certificate is issued by Technovids and is not a Microsoft credential or exam result.
Plan your next step with this course
Tell us whether you are enquiring for yourself or a team, which development tasks matter and what access you have. We will confirm suitable delivery options and commercial details in writing.