
No-code assistance or technical analytics?
Separate Excel and BI workflows from Python, forecasting and model-building prerequisites.
Corporate AI training · Onsite & live online
Based in Bengaluru · delivering across India
Analytics enablement · BI, analysis and communication
Help analysts use AI to accelerate analysis and communication while preserving semantic-model quality, data access and human validation.
AI Training for Data Analysts and BI Teams is private corporate training for analysts, BI developers, reporting teams and analytics managers. It can combine no-code AI-assisted analysis, Excel or Power BI workflows, SQL and DAX support, narrative generation, anomaly investigation and an optional Python or machine-learning track. The training is scoped to the organisation’s approved tools and data environment; access to Copilot or other product features depends on the client’s licences, capacity, region and administrator settings.
Updated
Scope boundary: No tool can compensate for poor data definitions, access controls or semantic models. The client remains responsible for licences, capacity, data permissions and production publishing.
The same AI feature has different value and risk for a report consumer, analyst and semantic-model owner.
Separate Excel and BI workflows from Python, forecasting and model-building prerequisites.
Identify approved datasets, definitions, semantic models and access boundaries before asking AI to interpret results.
Formulas, queries, calculations, narratives and anomalies should trace back to source data and business rules.
AI may draft an explanation; the analyst confirms materiality, context, uncertainty and the final message.
The exercises reflect the selected BI stack and split assistance from accountable analytical judgement.
Turn a business request into a defined question, metric, grain, comparison and acceptance check.
Use AI to explain or draft a bounded calculation or query from a known schema.
Explore patterns and produce an analytical view using the approved Excel or BI environment.
Draft a management summary from reviewed measures, variances and context.
Use AI to propose checks and segment an unusual result rather than label every deviation a problem.
For prepared cohorts, move from BI analysis into reproducible Python and introductory model workflows.
The courses below differ in tool, prerequisite and depth; they are not interchangeable labels.
Use generative AI to frame, analyse, verify and communicate business data without coding.
Best for: Analysts and business professionals needing a no-code workshop
Develop data preparation, semantic modelling, DAX, visualisation and publishing capability.
Best for: Microsoft-centred BI teams
Build a broader applied analytics pathway across spreadsheets, SQL, BI, interpretation and AI assistance.
Best for: Professionals building cross-tool analytics capability
Use Python to prepare data, build and evaluate models, and communicate model limitations.
Best for: Analysts moving into model-building work
Choose one shared foundation, then split practice when prerequisites diverge.
| Decision point | No-code / BI assistance | Python / model-building route |
|---|---|---|
| Best for | Analysts working mainly in Excel and BI tools | Analysts who will code reproducible analysis or models |
| Prerequisite | Data and reporting familiarity | Analytics foundation plus readiness to learn or use Python |
| Practice | Questions, formulas, visuals, narratives and review | Data preparation, code, models, evaluation and interpretation |
| Output | Reviewed analytical workflow or report narrative | Notebook, model evidence and documented limitations |
Outputs remain tied to approved tools and a known data definition.
Questions, metrics, comparisons and acceptance checks are explicit before work begins.
Queries, formulas and narratives are tested and reconciled rather than copied.
Findings distinguish data, interpretation, uncertainty and recommendation.
The team knows whether BI depth, SQL, Python, ML or adoption support comes next.
One repeatable engagement process keeps the agenda connected to the team’s work while leaving commercial and delivery details explicit.
Chandan, Technovids’ corporate L&D expert, clarifies the audience, need, delivery constraints and expected decisions.
A suitable Technovids expert reviews the starting level, tools, examples, risks and practical output.
The proposal confirms the agenda, format, schedule, participant assumptions, inclusions, exclusions and commercials.
Short explanations alternate with demonstrations, practice, feedback and a workplace application.
Participants leave with the agreed artefacts and the client receives the completion or follow-up information included in the proposal.
The written scope confirms the tools, datasets and outputs included.
Question, data, method, validation, interpretation and communication steps.
A formula, query, report, narrative or notebook with visible checks.
No-code, BI developer, SQL, Python and model-building needs separated by role.
Candidate reporting or analysis workflows with owners, data and evidence needs.
Every programme teaches employees to work inside organisational boundaries and keep human accountability visible.
Participants learn what information may be entered, what must remain out, and when a sanctioned workspace or controlled example is required.
Facts, calculations, sources, tone and decision impact are checked against the original material and the purpose of the task.
AI may assist a step; an accountable person still reviews the output and owns the decision or communication.
Teams compare quality, effort, risk and adoption for a bounded workflow instead of claiming generic productivity gains.
Microsoft documents capacity, administrator, region and access requirements. Technovids confirms the client’s actual environment rather than assuming every Copilot feature is available.
Real instructor-led sessions from the Technovids delivery archive. The photographs show delivery context; they do not imply a result for a future cohort.


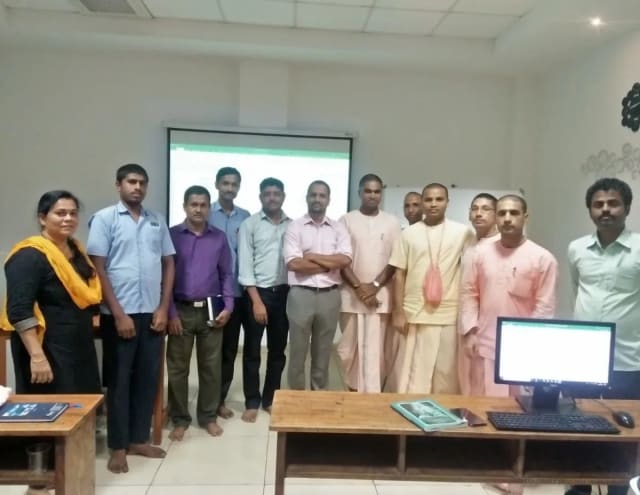
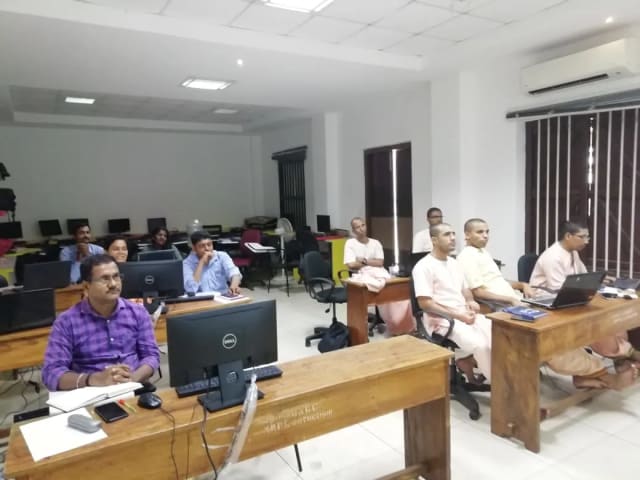


Technovids assigns a suitable trainer after the audience, subject depth and delivery needs are confirmed.
Co-founder & Lead Instructor, Technovids Consulting
Pankaj is a co-founder and the lead instructor at Technovids Consulting. His programme work spans practical AI adoption, AI engineering, evaluation, responsible production AI, data analytics and corporate learning design, with an emphasis on hands-on exercises connected to workplace tasks.
Expertise:
AI & Machine Learning Trainer, Strategist and Consultant
Junaid is an AI and machine-learning trainer, strategist and consultant with more than 22 years of training experience. His work combines enterprise AI education, business-centred adoption, responsible AI practices and applied solution design, helping professional audiences connect AI concepts to real organisational needs.
M.E. in Computer Engineering, specialising in Artificial Intelligence · author of programming books on Python, Java and C++
Expertise:
Technical Trainer & Curriculum Architect
Pradeep is a technical trainer and curriculum architect with more than 20 years of experience across enterprise technology, cloud infrastructure and advanced AI systems. He designs practitioner-focused programmes, labs and assessments covering AI, LLM systems, Python and machine learning, translating complex technical subjects into structured learning experiences.
Bachelor of Engineering in Electrical Engineering · instructor-led, virtual and blended delivery
Expertise:
The proposal names or confirms the trainer assignment for the engagement; every trainer shown here does not teach every programme.
Updated
Approved client relationships, participant feedback and real training photographs provide context on Technovids delivery. They do not guarantee a particular adoption or business result.




















Practical training programmes delivered for learners, professionals and teams across AI, data, cloud, productivity and professional skills.
What professionals found useful, practical and relevant to their day-to-day work.
Technovids AI training was very practical and well structured. The sessions helped me understand how AI concepts can be applied in real data engineering and business workflows, instead of only learning theory. The trainer explained the topics clearly with relevant examples, which made the learning experience valuable and easy to follow.
Technovids delivered the AI training in a very practical and industry-relevant way. As a data engineer, I found the examples and hands-on discussions useful for understanding how AI can improve data workflows, automation, and decision-making. The sessions were well planned and easy to understand.
The AI training program by Technovids was insightful and professionally delivered. It covered important AI concepts in a simple and practical manner, with examples that connected well with data and analytics use cases. The sessions helped me build a stronger foundation in applying AI in real business scenarios.
Finding a course that goes deep into Retrieval-Augmented Generation (RAG) is surprisingly hard. Most just scratch the surface. Technovids delivered an incredibly detailed deep dive into RAG pipelines, LangChain, and LlamaIndex. The hands-on projects helped me understand how to manage vector databases and chunking strategies effectively. It’s easily the most practical Generative AI training I’ve taken.
I enrolled in this program to figure out how to leverage AI for data storytelling and reporting. The practical walkthroughs on using AI tools for data analysis, specifically around Microsoft Copilot and advanced prompting for business intelligence, were eye-opening. The Technovids trainers keep it 100% practical. I walked away with actionable templates that I started using at work the very next day.
Our team used to spend two full days every month pulling together the board report. After this workshop we got it down to four hours using ChatGPT and Power BI Copilot. The ROI was immediate.
Published answers define the page scope. A written proposal records engagement-specific terms.
Not for the no-code or BI-assistance route. Python-enabled analytics and model-building are separate pathways with prerequisites confirmed in the proposal.
Power BI, Excel and related Microsoft workflows are common options. Tableau or another established client tool can be considered when the requested modules and trainer expertise support it. The proposal names the actual stack.
No. Microsoft documents capacity, tenant, region and access requirements, and some experiences may be in preview. The client should confirm its current environment before exercises are finalised.
They can share foundations, but deeper practice should split. BI developers need modelling, calculation and publishing workflows; analysts need question framing, interpretation and communication.
Only when the organisation explicitly approves the dataset and environment. A safer default is synthetic or anonymised data that mirrors the schema and business rules without exposing personal, confidential or production records.
Compare a defined reporting or analysis task on accuracy, reconciliation, time, review effort and clarity before and after practice. Do not apply generic productivity percentages to the team.
2nd Floor, Chandrodaya Complex, 19/19, 24th Main Rd, near Hanuman Temple, Agara Village, 1st Sector, HSR Layout, Bengaluru, Karnataka 560102.
Please contact us before visiting the head office. The HSR Layout address is a head office, not a walk-in public classroom.