
Live instructor-led · Public cohorts and corporate teams
Advanced Excel Training in Bangalore: Dashboards, PivotTables & MIS Reporting
Move beyond manual copy-paste reporting. Build reliable formulas, refreshable Power Query steps, PivotTable analysis and management-ready Excel dashboards using realistic business datasets.
- Duration
- 15 live hours
- Audience
- MIS, finance, HR and operations
- Delivery
- Live online or corporate onsite
- Level
- Basic Excel to advanced reporting
What is the Advanced Excel Training course?
Advanced Excel Training is a 15-hour instructor-led course for professionals who already use spreadsheets and want faster, more reliable reporting. Participants practise formulas, lookups, data cleaning, PivotTables, charts, dashboards, what-if analysis and Power Query, then combine those skills in an end-to-end MIS reporting project. It is available as a public live-online cohort or a private corporate programme.
Is this the right course for you or your team?
Who it is for
- MIS and reporting executives who assemble recurring packs
- Finance and accounts professionals working with monthly reports
- HR, operations, sales and business analysts using spreadsheets daily
- Managers who need to inspect and improve team reporting models
Situations it fits
- Monthly reports depend on repeated copy-paste steps
- Lookups and formulas break when data changes
- Pivot reports take too long to refresh and explain
- Dashboards look busy but do not answer a clear question
Prerequisites
- Comfort with worksheets, rows, columns and basic formulas such as SUM
- A suitable laptop with an agreed Excel version
- Willingness to practise between sessions in a public cohort
The Excel problems this course tackles
Each topic is connected to work a reporting professional actually has to complete.
“The same cleanup every month”
Exports arrive with inconsistent columns, dates and labels.
What you practise
Build documented Power Query transformations that can be refreshed.
“Lookups fail silently”
A changed key or range returns incomplete reporting.
What you practise
Use appropriate lookup patterns, error handling and reconciliation checks.
“Dashboards do not guide decisions”
Too many visuals obscure the actual KPI movement.
What you practise
Select measures and charts around the audience’s decision.
“MIS packs are rebuilt by hand”
Formatting and calculations are repeated across sheets.
What you practise
Combine tables, formulas, pivots and reusable layouts into one reporting workflow.
What participants will be able to do
Practise the skills below through course exercises, then check the results and explain how you would apply them to your work.
Write dependable business formulas
Combine conditional, aggregation, text, date and error-handling functions for recurring reports.
Match data across sources
Use XLOOKUP or compatible alternatives, INDEX-MATCH and reconciliation checks appropriately.
Analyse with PivotTables
Group, filter, calculate and explore business data with PivotTables, slicers and PivotCharts.
Build readable dashboards
Choose KPIs and visuals, structure a management view and test whether it answers the intended question.
Create refreshable data preparation
Import, clean, reshape and combine files with Power Query instead of repeating manual edits.
Deliver an end-to-end MIS workbook
Turn a raw dataset into a checked, documented and presentation-ready report.
Applied to each team’s real work
MIS & reporting
Monthly KPI packs, target tracking, variance summaries and refreshable dashboards.
Finance & accounts
Reconciliations, budget comparisons, ageing analysis and scenario models.
HR & operations
Headcount trackers, attendance analysis, service metrics and exception reporting.
Sales & business analysis
Pipeline tracking, territory performance, product mix and customer summaries.
Excel is the working environment—not a slide topic
Exercises are completed in Excel. Features are aligned to the version participants actually use.
Microsoft Excel
by MicrosoftCore spreadsheet, analysis and reporting environment.
- Formulas and lookups
- PivotTables and charts
- Dashboard construction
- Used in
- Every module and the final MIS reporting project.
- What to verify
- Feature availability differs by version. XLOOKUP is not available in Excel 2016 or Excel 2019.
Power Query
by MicrosoftRepeatable import, cleaning, transformation and file-combination workflows.
- Cleaning exports
- Combining monthly files
- Refreshable preparation steps
- Used in
- The recurring-report preparation lab.
- What to verify
- Confirm data types, row counts and transformation order after every refresh.
15 hours · 15 live hours
Detailed curriculum
The agenda progresses from reliable spreadsheet structure to repeatable reporting. Module depth is adjusted after the starting-level check.
Module 1 Professional Excel foundations
- Efficient navigation and shortcuts
- Tables, named ranges and references
- Number formats and clean worksheet structure
Practical activityTurn an untidy export into a structured analysis table.
Module 2 Business formulas and error handling
- IF, AND and OR logic
- SUMIFS, COUNTIFS and AVERAGEIFS
- IFERROR and calculation checks
Practical activityBuild a monthly performance summary with conditional calculations.
Module 3 Lookups and matching
- XLOOKUP and compatible alternatives
- INDEX and MATCH
- Multiple-condition matching and reconciliation
Practical activityMatch employee or product records across two source files.
Module 4 Text, dates and data quality
- Text and date functions
- Removing duplicates and validation
- Preparing clean analytical fields
Practical activityRepair a customer dataset and document the data-quality decisions.
Module 5 PivotTables and PivotCharts
- Grouping, filtering and value settings
- Calculated fields, slicers and timelines
- Refresh and maintenance routines
Practical activityCreate a filterable MIS report from transaction data.
Module 6 Charts, dashboards and storytelling
- Selecting the right chart
- KPI layout and visual hierarchy
- Interactive filters and dashboard review
Practical activityBuild a management dashboard and explain the decision it supports.
Module 7 What-if analysis
- Goal Seek
- Scenario Manager
- Sensitivity analysis for planning
Practical activityModel a pricing, budget or target decision under multiple scenarios.
Module 8 Power Query and final workflow
- Importing and transforming data
- Combining files
- Refresh checks and handover documentation
Practical activityDeliver a refreshable report from raw files to final dashboard.
Need a learning plan around your goals?
Share your experience, stack and goals. The proposal sets out the suitable modules.
Exercises and practical outputs
Short demonstrations are followed immediately by work in the spreadsheet.
How every module runs
See the pattern
The trainer demonstrates a technique against a realistic reporting problem.
Build it
Participants reproduce the workflow on a practice dataset.
Break and check it
The group tests missing values, changed ranges and common error cases.
Apply it
Participants combine the technique into a report they can explain and maintain.
Exercises use representative, non-sensitive examples. Outputs are produced during the workshop for practice and review; anything participants keep is their own working material.
A correct-looking report can still be wrong
Every course treats data quality, calculation review and access control as part of the analytical workflow—not as an optional final check.
Check the current product documentation and your organisation’s data-handling rules before applying these workflows.
Use approved data
Use public, synthetic, sanitised or organisation-approved datasets. Remove personal and confidential fields before using external AI services.
Trace every number
Reconcile row counts, totals, filters, joins and time periods against the source before a report supports a decision.
Review generated logic
Read formulas, DAX, SQL, calculated fields and Python generated with AI. Test boundary cases instead of trusting fluent output.
Publish with controls
Confirm permissions, refresh ownership, data classification and reviewer responsibility before sharing a workbook or dashboard.
How the course is tailored and delivered
Private programmes are adapted around the reports, datasets, tool versions and decisions participants handle at work. Public cohorts use neutral practice data so people from different organisations can work safely.
From first conversation to evaluation
Map the work
Identify participant roles, current skill level, recurring reports and the decisions the training should support.
Confirm the environment
Check software versions, licences, database access, security rules and whether client data may be used in exercises.
Shape the labs
Choose representative datasets and outputs, then set the depth of formulas, modelling, visualisation or code.
Practise and review
Participants build during the session, explain their choices and use a review checklist before presenting the result.
Delivery formats
Public live-online cohort
Best for: Individuals and small teams following a published cohort schedule
Instructor-led sessions run on Zoom with notes, assignments, lab instructions and recordings in the Technovids LMS. Recording access lasts three months after the cohort.
Private corporate programme
Best for: Teams that want their own datasets, reporting standards and delivery calendar
Delivered live online or onsite. Scope, participant count, exercises, materials, support and commercials are confirmed in the written proposal.
Delivery modes
Live online
Interactive instructor-led sessions with screen sharing, guided practice and review. Public cohorts are hosted through Zoom and the Technovids LMS.
Onsite for corporate teams
Delivered at the client location with the same practical curriculum, using approved or sanitised organisational data where appropriate.
Practical training, with people doing the work
A selection of Technovids instructor-led sessions. The photographs show delivery environments, not results attributed to a particular course or client.

Photo 1 of 10: Hands-on session 
Photo 2 of 10: Group photo 
Photo 3 of 10: Hands-on session 
Photo 4 of 10: Group photo 
Photo 5 of 10: Classroom session 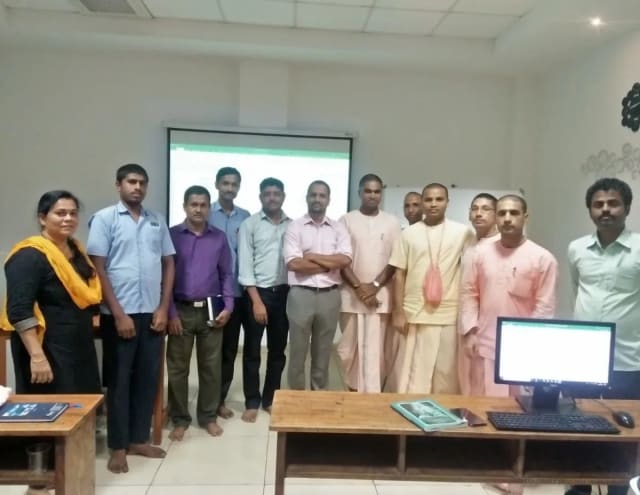
Photo 6 of 10: Group photo 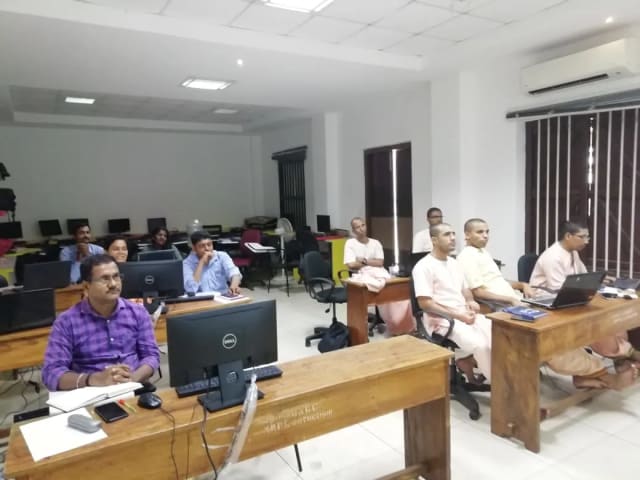
Photo 7 of 10: Computer-lab session 
Photo 8 of 10: Group photo 
Photo 9 of 10: Classroom session 
Photo 10 of 10: Group photo
Course details at a glance
The published course parameters on one page. Final scope, dates and fees are confirmed in the written proposal.
Discuss your training goals| Course | Advanced Excel Training |
|---|---|
| Duration | 15 live hours; time per module and the final schedule are confirmed with the cohort or proposal |
| Audience | MIS, finance, HR, operations, sales and business-reporting professionals |
| Prerequisite | Basic Excel familiarity; no VBA or programming required |
| Delivery | Public live online; private live online or onsite |
| Equipment | Participant laptop with the agreed Excel version |
| Assessment | Guided exercises plus an end-to-end reporting project |
The trainer assigned to your programme
Technovids assigns a trainer whose technical depth and delivery experience fit the agreed curriculum and audience.
Pankaj Rana
Co-founder & Lead Instructor, Technovids Consulting
Pankaj is a co-founder and the lead instructor at Technovids Consulting. His programme work spans practical AI adoption, AI engineering, evaluation, responsible production AI, data analytics and corporate learning design, with an emphasis on hands-on exercises connected to workplace tasks.
Expertise:
- Practical AI adoption
- Prompting and evaluation
- Responsible AI
- Corporate learning design
Junaid Khateeb
AI & Machine Learning Trainer, Strategist and Consultant
Junaid is an AI and machine-learning trainer, strategist and consultant with more than 22 years of training experience. His work combines enterprise AI education, business-centred adoption, responsible AI practices and applied solution design, helping professional audiences connect AI concepts to real organisational needs.
M.E. in Computer Engineering, specialising in Artificial Intelligence · author of programming books on Python, Java and C++
Expertise:
- Enterprise AI and ML training
- AI strategy and adoption
- Responsible AI
- Applied AI solution design
Pradeep Varadarajan
Technical Trainer & Curriculum Architect
Pradeep is a technical trainer and curriculum architect with more than 20 years of experience across enterprise technology, cloud infrastructure and advanced AI systems. He designs practitioner-focused programmes, labs and assessments covering AI, LLM systems, Python and machine learning, translating complex technical subjects into structured learning experiences.
Bachelor of Engineering in Electrical Engineering · instructor-led, virtual and blended delivery
Expertise:
- AI and LLM systems
- Curriculum architecture
- Python and machine learning
- Hands-on lab design
The final trainer assignment is confirmed with the cohort schedule or corporate proposal.
Updated
Organisations we have trained, and participant perspectives
Client relationships and permissioned participant feedback provide context on Technovids delivery. They are not promises of a specific learning or business outcome.
Organisations we have delivered training for




















Practical training programmes delivered for learners, professionals and teams across AI, data, cloud, productivity and professional skills.
Participant experiences across workplace roles
What professionals found useful, practical and relevant to their day-to-day work.
- Gauraw DeshmukhData Engineer · Capgemini
Technovids AI training was very practical and well structured. The sessions helped me understand how AI concepts can be applied in real data engineering and business workflows, instead of only learning theory. The trainer explained the topics clearly with relevant examples, which made the learning experience valuable and easy to follow.
- PriyanshaSoftware Developer
The AI training from Technovids helped me gain a better understanding of Generative AI, prompt engineering, and practical AI use cases for software development. The course was clear, interactive, and focused on real-world applications. It gave me confidence to explore AI tools more effectively in my work.
- Sidda RajuData Engineer
Technovids delivered the AI training in a very practical and industry-relevant way. As a data engineer, I found the examples and hands-on discussions useful for understanding how AI can improve data workflows, automation, and decision-making. The sessions were well planned and easy to understand.
- Akshat KabraData Engineer
The AI training program by Technovids was insightful and professionally delivered. It covered important AI concepts in a simple and practical manner, with examples that connected well with data and analytics use cases. The sessions helped me build a stronger foundation in applying AI in real business scenarios.
- MangeshSoftware Engineer · Siemens
Technovids conducted the AI training in a very effective and engaging manner. The sessions were practical, easy to follow, and focused on how AI can be used in real software engineering and business workflows. It was a valuable program for understanding the current direction of AI adoption in the industry.
- ReshuSoftware Developer
Technovids AI training was a very useful learning experience. The course explained AI concepts in a practical way and showed how developers can use AI tools to improve productivity, problem-solving, and application development. The trainer's approach was simple, clear, and focused on industry use cases.
Common questions before planning this course
Answers about the published course. The written proposal records any agreed customisation, delivery details and commercials.
Are public cohorts available for Advanced Excel Training?
Public cohorts are offered live online when dates are published. Submit an enquiry for the next available schedule. A date is not reserved until Technovids confirms the cohort in writing.
What is included for a public-cohort learner?
The Technovids LMS includes session notes, assignments, lab instructions and recordings for three months after the cohort. Completion requirements and the certificate process are explained at the start.
Is a completion certificate provided?
Yes. Learners who meet the stated completion requirements receive a Technovids completion certificate with a unique certificate ID that can be verified on the Technovids website. It is not a vendor certification.
Who provides the laptop, software and licences?
Participants use their own suitable laptop. The required software version, accounts and licences are confirmed before delivery. For private programmes, a sandbox or virtual machine can be scoped separately when needed.
Can the course be delivered for a corporate team?
Yes. The private version can use your approved datasets, reporting standards and business scenarios. Delivery may be live online or onsite, with scope and commercials confirmed in the proposal.
Which Excel version is needed?
The version is confirmed before delivery. Most core topics work across supported desktop editions, while some functions differ. For example, Microsoft documents that XLOOKUP is not available in Excel 2016 or Excel 2019, so compatible alternatives are taught where needed.
Does the course include VBA?
VBA is not part of the standard agenda. It can be scoped as an extension for a private corporate programme if macros are central to the team’s work.
Plan your next step with this course
Tell us whether you are enquiring for yourself or a team, which development tasks matter and what access you have. We will confirm suitable delivery options and commercial details in writing.