
- QlikView + SQL + Excel integration for analytics
QlikView Training in Bangalore | Online Classes by Industry Experts
Elevate Your Data Analytics Skills with Expert-Led Training
Master QlikView dashboards, data modeling and scripting with Technovids’ project-driven QlikView training in Bangalore. Learn how to turn raw data into fast, interactive analytics that hiring managers actually care about.
Schedule a Free Demo
Talk to an expert trainer. Get clarity on syllabus, batches & career outcomes.
- 📞 Callback within 24 working hours
- 🚫 No spam. No pressure selling
Course Duration
20 hours (Training + Practicals)
Batches
Weekdays & Weekends
Mode of Training
Online · Instructor-led
Assignments
20+ hands-on exercises & projects
Trainers
Industry-experienced professionals
Class Recordings
Access to recorded sessions
About QlikView Training at Technovids
Master QlikView dashboards, scripting and data modeling with a job-ready, project-driven curriculum designed for BI developers, data analysts, MIS professionals and freshers entering the analytics field.
Technovids offers a comprehensive QlikView Training in Bangalore & Live Online, covering real-world dashboard development, ETL scripting, QVD layer design, set analysis, and QlikView Server deployment. This structured program prepares learners to build interactive dashboards, optimize performance, and publish applications used by business teams.
Key Features of QlikView Training
- Hands-on QlikView scripting—load statements, filters, joins & transformations
- Design clean data models without synthetic keys or circular references
- Create dashboards with KPIs, charts, drill-downs & guided analytics
- Advanced expressions, variables & set analysis for calculations
- Build QVD layers for optimized extract–transform–load (ETL) pipelines
- QlikView Server: deployment, reload scheduling & Access Point publishing
- Section Access: implementing row-level data security
- Real-world case studies in sales, MIS, operations & finance analytics
Why Choose Technovids for QlikView Training in Bangalore?
As a focused QlikView training institute in Bangalore, Technovids helps data analysts, BI developers, MIS teams and fresh graduates move from basic reporting into powerful, model-driven QlikView dashboards used in real organizations.
Built for Real BI & QlikView Roles
Topics mapped to day-to-day work of QlikView developers and BI analysts—data loading, QVD layer design, set analysis, security and performance, not just tool navigation.
Trainers from BI & Analytics Projects
Learn from professionals who have built QlikView dashboards for finance, sales, operations and MIS, bringing real project experience instead of theory-only sessions.
Case Studies & Practical Dashboards
Work on business-style datasets and build complete QlikView applications—scripts, data models, charts, KPIs and guided analytics you can showcase in interviews.
Bangalore Classroom & Live Online
Weekday and weekend batches, with QlikView online training and classroom options. Recordings and doubt-support make it manageable for working professionals and students.
QlikView Desktop, Server & QVDs
Learn using QlikView Desktop, QlikView Server, QVD-based data layers and SQL/Excel sources so you understand how enterprise BI solutions are really built and deployed.
Guidance for QlikView & BI Careers
Profile review, resume tips, project portfolio guidance and interview-oriented questions for QlikView developer, BI analyst and MIS roles in Bangalore and across India.
What You’ll Learn in QlikView Training
End-to-end QlikView skills for dashboards, data modeling and BI development.
- Connect Excel, CSV, SQL and other sources; build strong extract & load pipelines.
- Write clean QlikView load scripts—filters, joins, transformations & incremental loads.
- Design optimized data models without synthetic keys or circular references.
- Create dashboards with KPIs, charts, drill-downs and guided analytics.
- Work with expressions, variables and advanced set analysis for business calculations.
- Build a robust QVD architecture (extract → transform → presentation layers).
- Publish applications via QlikView Server & Access Point with reload scheduling.
- Implement Section Access for row-level data security and controlled visibility.
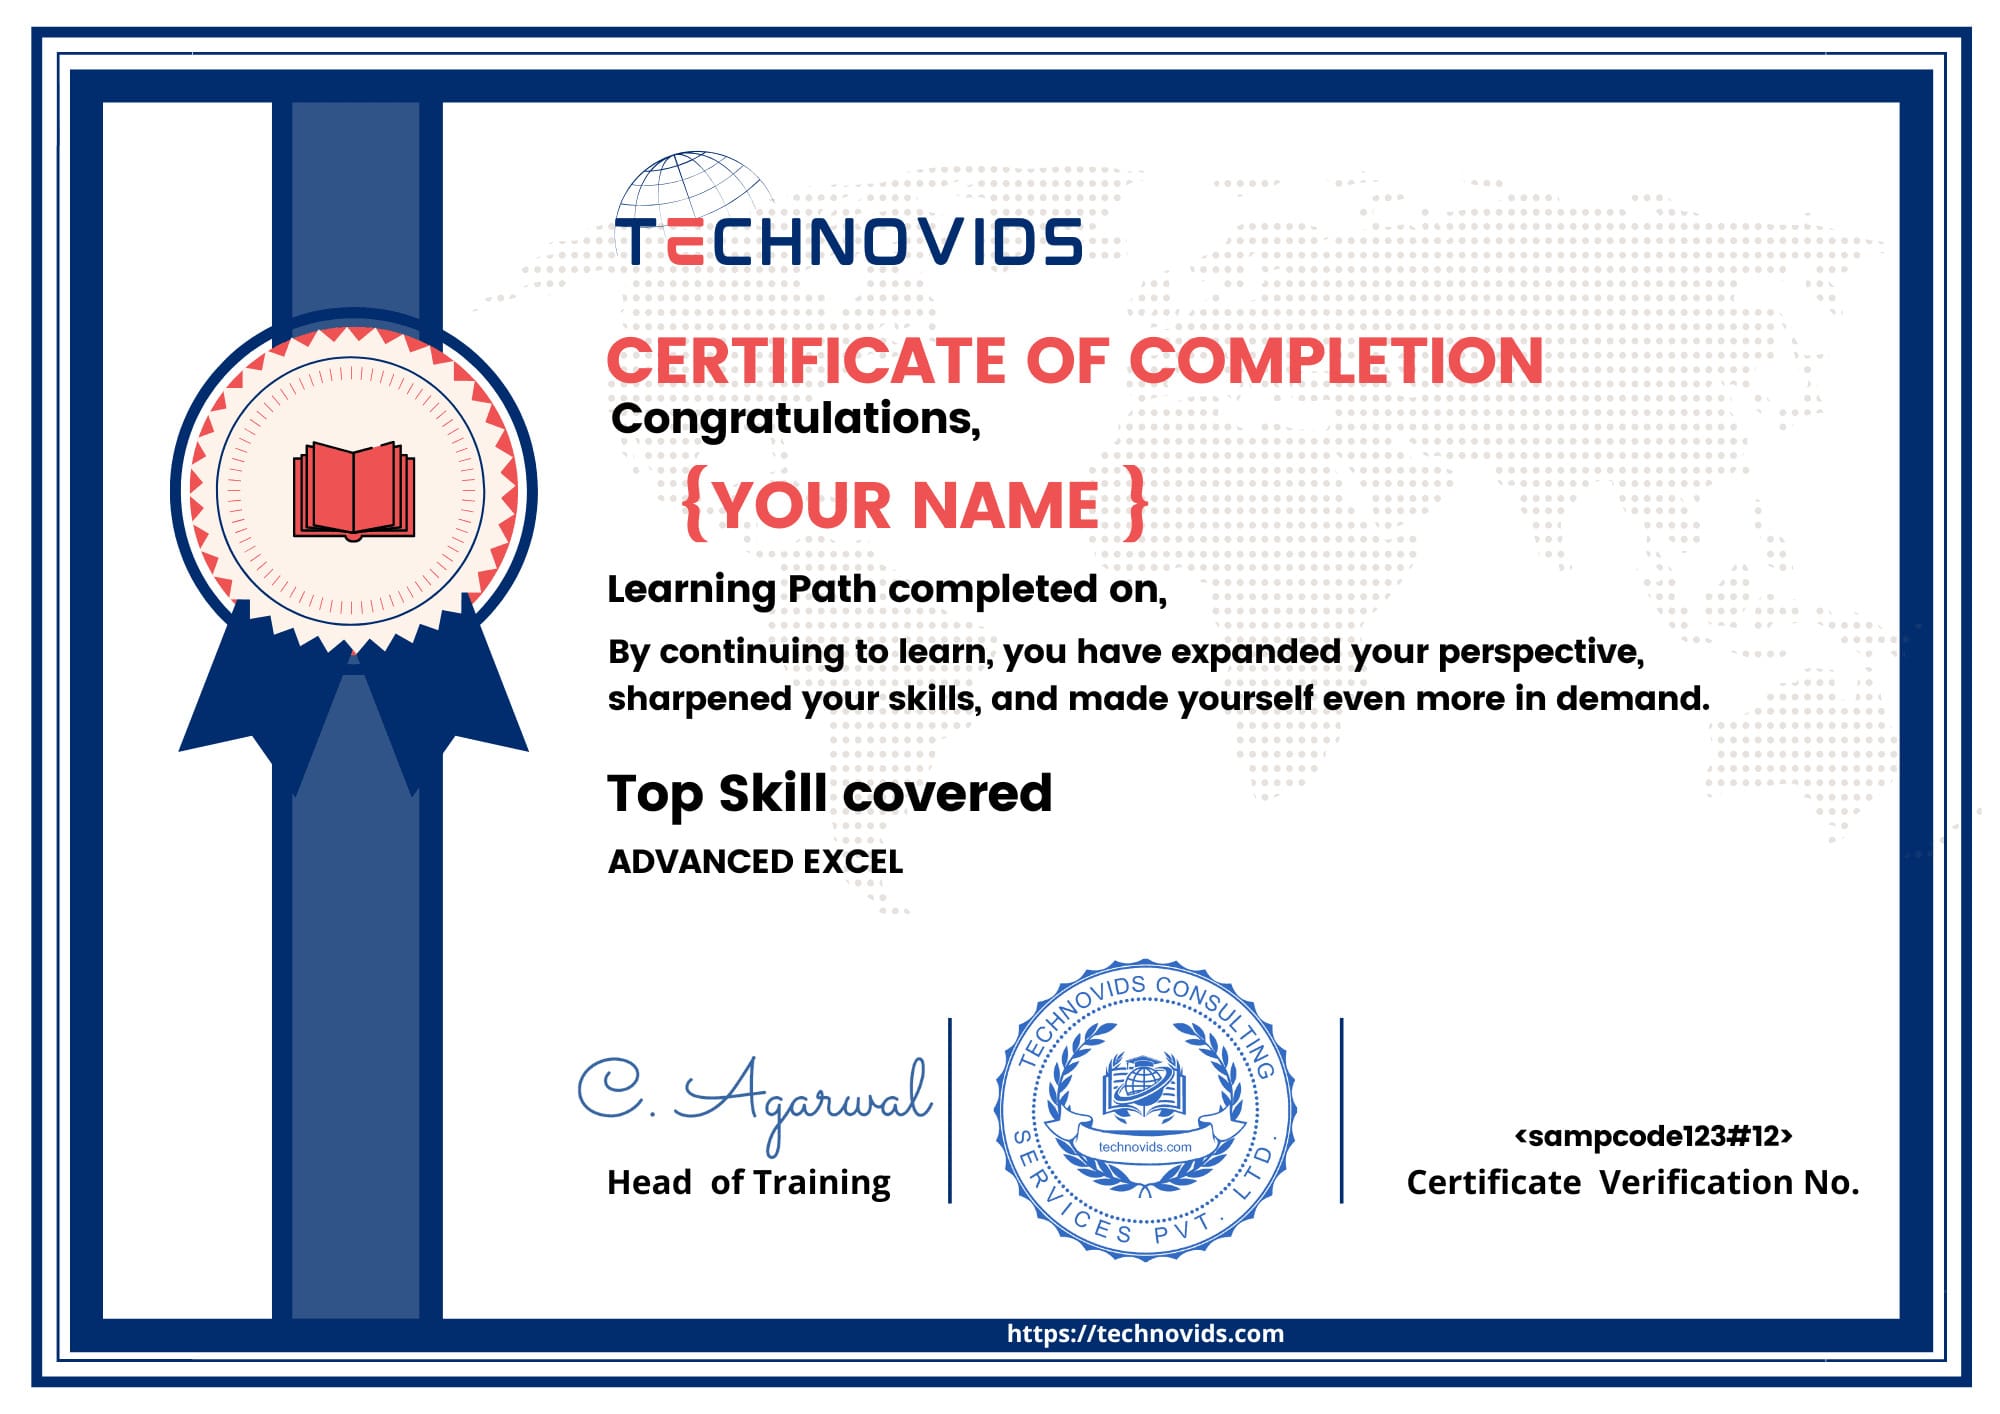
Course Completion Certificate from Technovids
Showcase that you have completed a structured, hands-on QlikView training program with Technovids and are ready for real BI projects.
- Official Technovids Course Completion Certificate with unique ID.
- Highlights your top skill covered – e.g., QlikView / Advanced Excel.
- Issued only after assignments and project evaluation.
- Downloadable as PDF – easy to share on LinkedIn, Naukri & email.
- Recognises your ability to build and read practical dashboards & reports.
- Backed by trainers with real BI & analytics experience.
QlikView Course Syllabus – Modules & Topics
A structured QlikView Training in Bangalore & Online that takes you from QlikView basics to production-grade dashboards, scripting, QVD layers and QlikView Server deployment. Each module includes hands-on exercises and case studies.
Module 1 – QlikView Basics & Environment
- Introduction to QlikView and the Qlik ecosystem (QlikView vs Qlik Sense)
- QlikView Desktop vs QlikView Server – architecture overview
- QlikView file types: QVW, QVD, QVS and their roles
- Interface tour: sheets, objects, properties, layout basics
- Connecting to Excel, CSV and database sources
- Building your first QlikView dashboard and reload
Module 2 – Scripting & Data Loading
- QlikView script editor, load statements and script execution flow
- Inline tables, resident loads and preceding loads
- Using WHERE, DISTINCT, mapping loads and applymap()
- Concatenation vs
NoConcatenateand controlling table structure - Basic transformations during load (cleaning, deriving fields)
- Debugging scripts and handling load errors
Module 3 – Data Modeling & Joins in QlikView
- Keys, synthetic keys and circular references – how they occur
- INNER, LEFT, RIGHT and OUTER joins in QlikView scripts
- Using link tables vs concatenated fact tables
- Star schema vs snowflake modeling in QlikView
- Best practices for a clean, maintainable data model
- Model viewer and troubleshooting data model issues
Module 4 – Charts, KPIs & Visual Design
- List boxes, tables, KPIs and text objects
- Bar, line, combo, pie and other chart types
- Expressions, aggregation functions and basic set analysis
- Variables, conditional show/hide and “what-if” scenarios
- Sorting, formatting and layout for business dashboards
- UX tips for MIS and management dashboards
Module 5 – Advanced Set Analysis & Time Intelligence
- Set analysis syntax, identifiers and modifiers
- Year-to-date (YTD), quarter-to-date (QTD), month-to-date (MTD)
- Last year vs current year, plan vs actual comparisons
- Bookmarks, alternate states and comparative analysis
- Common business scenarios in sales and finance analytics
Module 6 – QVD Layer, ETL Design & Performance
- QVD basics and advantages for performance & reusability
- Designing a three-layer QVD architecture (extract, transform, presentation)
- Incremental loads and handling large-volume data
- Optimizing expressions and chart performance
- Document properties and memory considerations
Module 7 – QlikView Server, Security & Access Point
- QlikView Server components, licensing and deployment overview
- Publishing QlikView documents to Access Point
- Reload tasks and scheduling basics
- Section Access for row-level security and user restrictions
- Governance, versioning and migration considerations
Module 8 – Capstone Project & Interview Preparation
- Choose a case study (sales MIS, finance dashboard, operations, etc.)
- Design data model, build dashboard and KPIs end-to-end
- Review of script, data model and performance
- Preparing a short walkthrough for stakeholders / interviews
- Discussion of QlikView / BI interview questions and portfolio tips
Who Should Take the QlikView Training in Bangalore?
This QlikView training is ideal for professionals and students who work with data, BI dashboards or MIS reports. If you want to move from basic reporting into QlikView-based business intelligence and analytics, this program at our QlikView training institute in Bangalore is designed for you.
Data Analysts & MIS Professionals
For analysts and MIS teams preparing daily or monthly reports who want to automate refreshes, reduce manual Excel work and deliver interactive QlikView dashboards to business users.
BI Developers & Reporting Engineers
Ideal for professionals already working with SQL, SSRS, Tableau or Power BI who want to add QlikView as a core enterprise BI skill for projects in banking, manufacturing, retail and consulting.
SQL & Database Professionals
Perfect for SQL developers and database engineers who want to move closer to business reporting by building data models, KPIs and dashboards directly on top of QlikView.
Aspiring BI & Data Science Learners
A strong starting point before advanced analytics tools. Learn how to explore, slice and visualize data in QlikView so you can later extend your skills to Qlik Sense, Power BI or Python.
Students & Fresh Graduates
Recommended for B.Com, BBA, MBA, BSc, BE and other graduates who want a practical BI tool on their resume and aim for entry-level QlikView developer, reporting or analyst roles.
Professionals Switching Careers
Suitable for non-IT and operations professionals planning a move into business intelligence, reporting or analytics roles where QlikView skills add strong value in interviews.
Career Opportunities After QlikView Training
Completing your QlikView Training in Bangalore or Online with Technovids prepares you for real-world business intelligence and reporting roles. You’ll be able to work with data, build dashboards and support decision-making for stakeholders across departments.
QlikView Developer / BI Developer
Design and maintain QlikView applications for sales, finance, operations and management teams. Responsibilities include scripting, data modeling, dashboard creation, performance tuning and working closely with business users to translate requirements into analytics.
MIS & Reporting Analyst
Use QlikView to automate recurring MIS reports, daily/weekly dashboards and management summaries. Ideal for professionals upgrading from Excel and static reporting into interactive, refreshable BI dashboards connected to live data sources.
QlikView to Qlik Sense & Modern BI Roles
Many enterprises are modernizing BI stacks. Skills gained in QlikView—scripting, data modeling, set analysis and Section Access—make it easier to move into Qlik Sense, Power BI, Tableau and cloud-based analytics roles with higher growth potential.
Data Analytics & Consulting Opportunities
With QlikView plus SQL and domain knowledge, you can contribute in analytics teams, consulting projects and CoEs that deliver dashboards and insights for multiple clients or business units across BFSI, pharma, manufacturing, retail and services.
BI Support & Production Operations
Support existing QlikView landscapes by monitoring reloads, handling issues, managing user access and helping teams adopt dashboards. This is a strong entry point before moving into full BI developer or architect roles.
Pathway to Advanced BI & Data Roles
QlikView gives you a solid foundation in data modeling and visualization. From here you can extend your skills with Power BI Training, Tableau Training or Data Analytics programs to grow into senior BI, analytics or data engineering roles.
Salary Trends for QlikView & BI Developers
QlikView skills are highly valued in BI, analytics and reporting roles. Actual packages vary by company, location and overall tech stack, but the ranges below give a realistic picture of how QlikView training in Bangalore can impact your CTC when combined with SQL and modern BI tools.
Excel / MIS Only
Typical entry-level MIS or reporting roles start around ₹3.5–4.0 LPA for candidates who mainly work on spreadsheets and basic dashboards.
QlikView MIS Analyst
Professionals using QlikView for dashboards & reports in small and mid-size teams can expect around ₹5.0–6.0 LPA depending on domain knowledge.
QlikView Developer (India)
Dedicated developers working on data models, expressions and production dashboards usually earn ₹7.0–9.0 LPA with 2–4 years of experience.
QlikView + SQL / BI Stack
Developers who combine QlikView with strong SQL, data warehousing and ETL skills commonly reach ₹10–12 LPA in analytics and consulting roles.
Multi-Tool BI Specialist
Senior professionals who work across QlikView, Qlik Sense, Power BI or Tableau on enterprise BI projects can see packages of ₹13–18 LPA+, depending on project ownership and domain.

QlikView Training in Bangalore – What You Get at Technovids
Many QlikView courses only walk through menus and sample dashboards. At Technovids, our QlikView training in Bangalore and online is designed to help you build production-ready BI dashboards, not just pass a tool demo.
What Most Institutes Offer
- Slide-based explanations of QlikView interface and menus.
- Limited focus on data modeling, script editor or performance.
- Generic examples not mapped to real MIS / analytics jobs.
- No clear path to move from QlikView basics to BI developer roles.
What You Get at Technovids
- Structured path from data connections to QlikView data models, expressions and set analysis.
- Hands-on work on dashboards for sales, finance, operations and management reporting.
- Best practices for script editor, incremental loads, section access and performance.
- Guidance on how to position QlikView with SQL, Qlik Sense, Power BI for better career growth.
Corporate & Campus QlikView Training
Practical QlikView training programs delivered for corporate teams, colleges, and institutions — focused on legacy BI environments and real-world reporting requirements.
Technovids delivers QlikView corporate training for BI developers, data analysts, and MIS teams working on existing QlikView-based analytics platforms. We also collaborate with colleges and universities to conduct industry-oriented QlikView workshops that help students understand traditional BI concepts and enterprise reporting workflows.
Why Organizations Choose Our QlikView Training
- Role-based QlikView curriculum for BI developers & MIS teams
- Corporate & campus batch delivery – online, on-site & hybrid
- Hands-on scripting, data modeling & dashboard development
- Working with legacy data sources & enterprise BI systems
- Real business use cases for sales, finance & operations reporting
- Industry-expert trainers with strong QlikView implementation experience
Corporate QlikView Training for Teams
Enable your BI, analytics and reporting teams with customized corporate QlikView training designed for business outcomes—not theory. For BFSI, retail, logistics, healthcare, ed-tech & IT companies.
Technovids delivers end-to-end corporate QlikView upskilling programs tailored to your data environment, business workflows and dashboard requirements. Teams learn how to build scalable QlikView applications, improve performance, automate refresh cycles and adopt Qlik BI best practices used in real organizations.
What Your Team Will Gain
- Customized QlikView training based on your datasets & business KPIs
- Hands-on workshops using Script Editor, data loads & Section Access
- End-to-end dashboard development for real company use-cases
- Performance tuning, data modeling & QVD layer optimization
- Integration guidance with SQL, Excel, ERP & business systems
- Dedicated Q&A sessions & post-training implementation support
- Flexible delivery — Online, Onsite (Bangalore), Hybrid
- Corporate batch size: 8–40+ employees
Trusted by Corporates & Universities
Our Advanced Excel and analytics training programs are trusted by leading corporates and academic institutions across India.









QlikView vs Power BI vs Qlik Sense – Which BI Tool Should You Learn?
QlikView, Power BI and Qlik Sense each serve different BI needs. This comparison helps you choose the right tool based on role, deployment, learning curve and job opportunities in Bangalore and globally.
| QlikView | Power BI | Qlik Sense | |
|---|---|---|---|
| Primary Focus | Guided analytics & pixel-perfect dashboards built by BI developers. | Self-service dashboards, ad-hoc analysis and cloud analytics for business users. | Modern visual analytics, associative exploration and highly interactive apps. |
| Typical Users | BI developers, MIS teams and IT-led reporting teams in established enterprises. | Data analysts, business users, managers, finance and operations teams. | BI teams, analysts and power users in organizations upgrading from QlikView. |
| Learning Curve | Moderate to steep – requires scripting, data modeling and QVD design. | Beginner-friendly – drag-and-drop + DAX; quick to get productive. | Between QlikView and Power BI – scripting helps, but UI is more visual and modern. |
| Deployment Style | On-premise oriented, strong in traditional enterprise BI environments. | Cloud-first (Power BI Service) with on-prem gateways when needed. | Cloud and on-premise options; often used in hybrid Qlik deployments. |
| Data Engine | Associative in-memory engine, great for complex model exploration. | Columnar in-memory engine with strong compression and DAX modeling. | Same associative engine family as QlikView, optimized for modern UX. |
| Use-Case Fit | Legacy Qlik landscapes, governed MIS, finance, operations & production dashboards. | New analytics projects, self-service BI, management reporting & KPI tracking. | Organizations modernizing QlikView apps into responsive, exploratory analytics. |
| Market Demand | Stable demand in organizations already invested in QlikView. | Very high demand across India and global markets for data analyst roles. | Growing demand in enterprises adopting Qlik Sense as their next-gen Qlik platform. |
| Best For | Professionals in or targeting companies with existing QlikView deployments. | Learners who want maximum job options in BI, analytics & reporting. | BI professionals who already know QlikView or are in Qlik-centric organizations. |
Tip: A strong BI profile often combines one core Qlik tool (QlikView or Qlik Sense) with Power BI and solid SQL skills.
Frequently Asked Questions – QlikView Training
These FAQs address common questions about the QlikView Training at Technovids. If you still have a doubt, please use the enquiry form and our team will get back to you with more details.
1. What is QlikView and where is it used today?
QlikView is Qlik’s earlier-generation BI and analytics tool. It is widely used for guided analytics and IT-controlled dashboards, especially in organisations that invested in QlikView several years ago.
Many companies still run important QlikView dashboards for sales, finance, operations and management reporting, which is why QlikView skills remain relevant for support, enhancement and migration projects.
2. Is QlikView still in demand in the job market?
Yes, there is still demand for QlikView in companies that have existing QlikView implementations. They need people who can maintain current dashboards, support change requests and participate in migration projects to newer tools like Qlik Sense.
The QlikView Training at Technovids is therefore useful if your current or target company actively uses QlikView, or if you want to work on projects where QlikView is part of the BI stack.
3. Is this QlikView Training online or classroom based?
The primary mode is live online, instructor-led QlikView training that you can attend from anywhere, aligned to Indian Standard Time (IST).
For corporate QlikView training, we can also plan onsite batches in Bangalore or fully online sessions for teams spread across locations.
4. Do I need a technical or programming background for QlikView?
You do not need to be a programmer to start this QlikView course. Basic comfort with computers and Excel is enough to begin. However, if you are familiar with SQL, basic scripting or any reporting tool, it will make learning easier.
We explain QlikView scripting, data modelling and expression writing in simple language so that learners from both technical and non-technical backgrounds can follow.
5. How long is the QlikView Training and what is the schedule?
The QlikView Training typically includes structured live sessions along with guided practice time. We run both weekday and weekend batches, depending on current demand and trainer availability.
When you enquire, we share the latest QlikView batch schedule and help you choose a timing that fits your availability.
6. What topics are covered in the QlikView Training?
The QlikView Training at Technovids covers QlikView architecture, data loading, scripting, data modelling, expressions, charts, dashboards and deployment concepts. We focus on practical dashboards and real use cases rather than only slides.
You can review the detailed QlikView syllabus on this page to see how the modules are structured from basics to project work.
7. Do I get recordings and materials for the QlikView course?
Yes. Learners get access to session recordings for revision during the course, along with sample QlikView files, scripts and datasets for practice.
These resources help you continue practising QlikView dashboards even after the live training is completed.
8. Will I receive a certificate after completing the QlikView Training?
Yes. After attending the sessions and completing the required exercises, you receive a QlikView Course Completion Certificate from Technovids.
This certificate is useful to show that you have gone through a structured QlikView training and can work on dashboards and basic scripting tasks.
9. Do you provide placement assistance after the QlikView course?
We do not promise guaranteed placements, but we support you with interview preparation, resume pointers and guidance on how to present your QlikView projects and experience.
Whenever possible, we also share relevant BI and QlikView / Qlik-related openings from our network. Final hiring decisions are always made by the recruiting companies.
10. Can you conduct QlikView corporate training only for our team?
Yes. Technovids can act as your QlikView corporate training partner. We customise the training plan, duration and examples based on your existing dashboards, data sources and business requirements.
Corporate QlikView programs can be delivered online or onsite in Bangalore, with reporting back to your L&D or project owners.
11. Should I learn QlikView or Qlik Sense or Power BI first?
That depends on your current environment and long-term goals. If your company already uses QlikView and you work on those dashboards, learning QlikView is a practical first step.
If your organisation is moving to modern self-service BI, you may also consider learning Qlik Sense or Power BI. You can explore our Power BI Training in Bangalore & Online and Advanced Excel Training in Bangalore as additional options for your BI learning path.
12. Is this QlikView course suitable if my company plans to move to Qlik Sense later?
Yes. Understanding QlikView gives you a good foundation in the Qlik way of working with data, scripting and dashboards. This makes it easier to move into Qlik Sense later when your organisation starts that journey.
If you are planning this transition, you can also explore our Qlik Sense Training in Bangalore for modern self-service BI, and refer to the official QlikView product page to understand how organisations typically upgrade from QlikView to Qlik Sense.
