Tableau being one of the most popular go-to tools for Data Analysis does not need any introduction. Almost every Data Analyst uses it at some point in the project life-cycle. But it has a shortcoming in terms of its limited capability to perform complex statistical analysis, because of the limited statistical functions that are available out-of-box inside Tableau.
This limitation has been overcome now with the introduction of a python package, TabPy, which can easily integrate Python’s statistical capabilities into Tableau. This article is an overview of the steps that need to be undertaken for this integration. Python and Tableau, both together is a great combination that can cater to most of the needs of an Analytics organization.
Go to the GitHub repository of TabPy and download the setup from there. TabPy setup will be downloaded in the form of a zip file. Extract the contents from the downloaded zip file and execute the setup.bat file from the download. This setup file will download all the dependencies required for TabPy on the machine. Upon successful installation, TabPy would start a local server on port number 9004.
Step 2: Setting up a connection with TableauPost successful installation of TabPy server, Tableau application needs to be connected with the running instance of TabPy server. In order to connect Tableau, go to the Help menu and check the option for Help > Settings and Performance > Manage External Service Connection

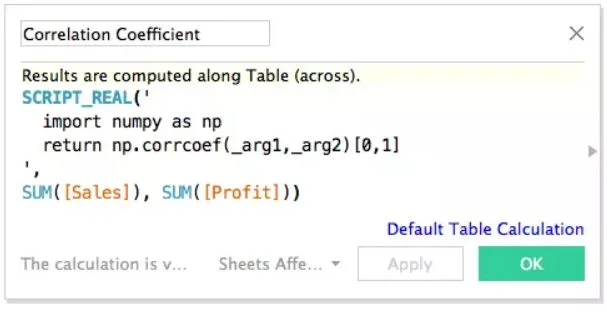
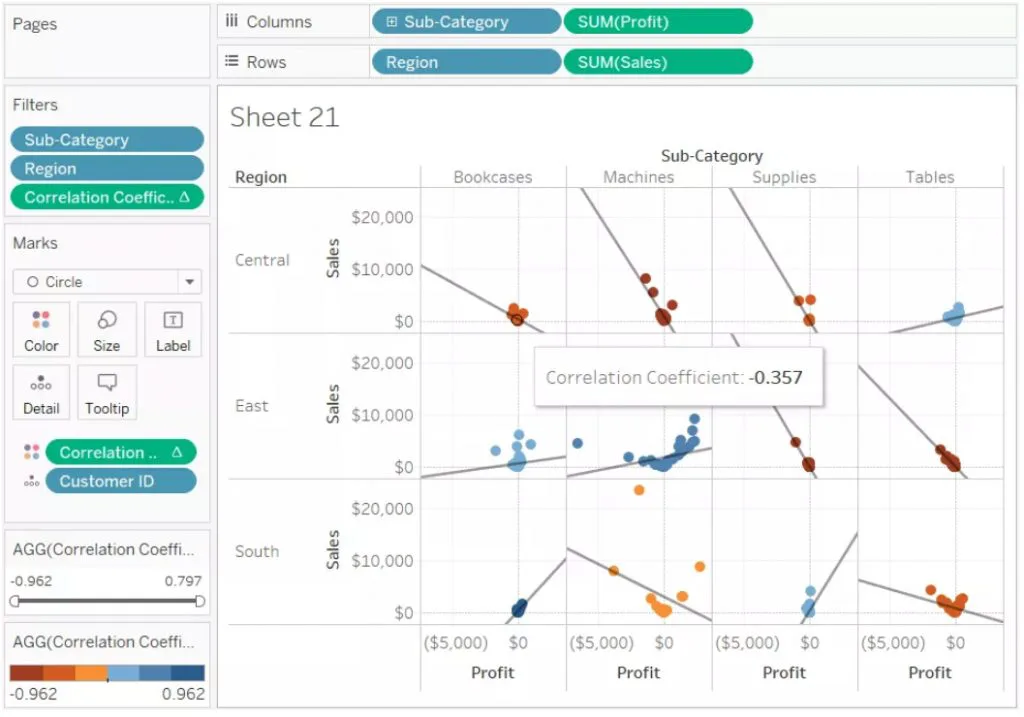
Now we are all set to execute statistical calculations on Tableau that will be executed on TabPy and the results will be available on Tableau’s front-end. Tableau provides various functions to execute Python-based scripts such as SCRIPT_STR, SCRIPT_REAL, SCRIPT_BOOL, and SCRIPT_INT.
Create a new Calculated field in Tableau and name it as Correlation Coefficient

Whole sequence of execution can be summarized as follows:
Action Initiation for Tableau dashboard -> Data sent to TabPy -> Result calculated on TabPy -> Final Result displayed on Tableau dashboard
Get Flexible online Tableau and Python Training by Technovids Consulting Services Pvt Ltd.

– Jobs requiring machine learning skills are paying an average of $114,000. Advertised data scientist jobs pay an average of $105,000 and advertised data engineering jobs pay an average of $117,000. – 59% of all Data Science and Analytics (DSA) job demand is in Finance and Insurance, Professional Services, and IT. – Annual demand for the fast-growing new roles of data scientist, data developers, and data engineers will reach nearly 700,000 openings by 2020. – By 2020, the number of jobs for all US data professionals will increase by 364,000 openings to 2,720,000 according to IBM. – Data Science and Analytics (DSA) jobs remain open an average of 45 days, five days longer than the market average.Source: Forbes.com
WhatsApp us

Request A Free Demo Today !